IELTS Academic Writing Task 1 can look intimidating when you first see a graph, chart, table or process diagram. There are numbers to compare, trends to explain and a strict time limit. But high-scoring reports do not depend on describing every detail. They depend on selecting the right information, organising it clearly and using accurate academic language.
The good news? You do not need to memorise dozens of complicated sentences to write an effective report.
You need a reliable structure, a clear overview and the ability to make meaningful comparisons.
This complete guide explains how to approach IELTS Academic Writing Task 1, what examiners look for, how to describe different visual types and which mistakes can prevent you from achieving Band 7 or higher.
Table of Contents
What Is IELTS Academic Writing Task 1?
IELTS Academic Writing Task 1 asks you to summarise, describe or explain visual information in at least 150 words.
You may be given:
- A line graph showing changes over time.
- A bar chart comparing categories.
- A pie chart showing proportions.
- A table presenting numerical information.
- A map showing changes to a location.
- A process diagram explaining how something works or is produced.
- A combination of two or more visual types.
You have approximately 20 minutes to complete the task. Writing Task 1 contributes one-third of your overall IELTS Writing score, while Task 2 contributes two-thirds.
Your response should be written in an appropriate academic style. You are not expected to give your personal opinion, explain why something happened without evidence or write a persuasive essay.
The main objective is simple: identify the important information and communicate it accurately.
The 4 Assessment Criteria for IELTS Academic Writing Task 1
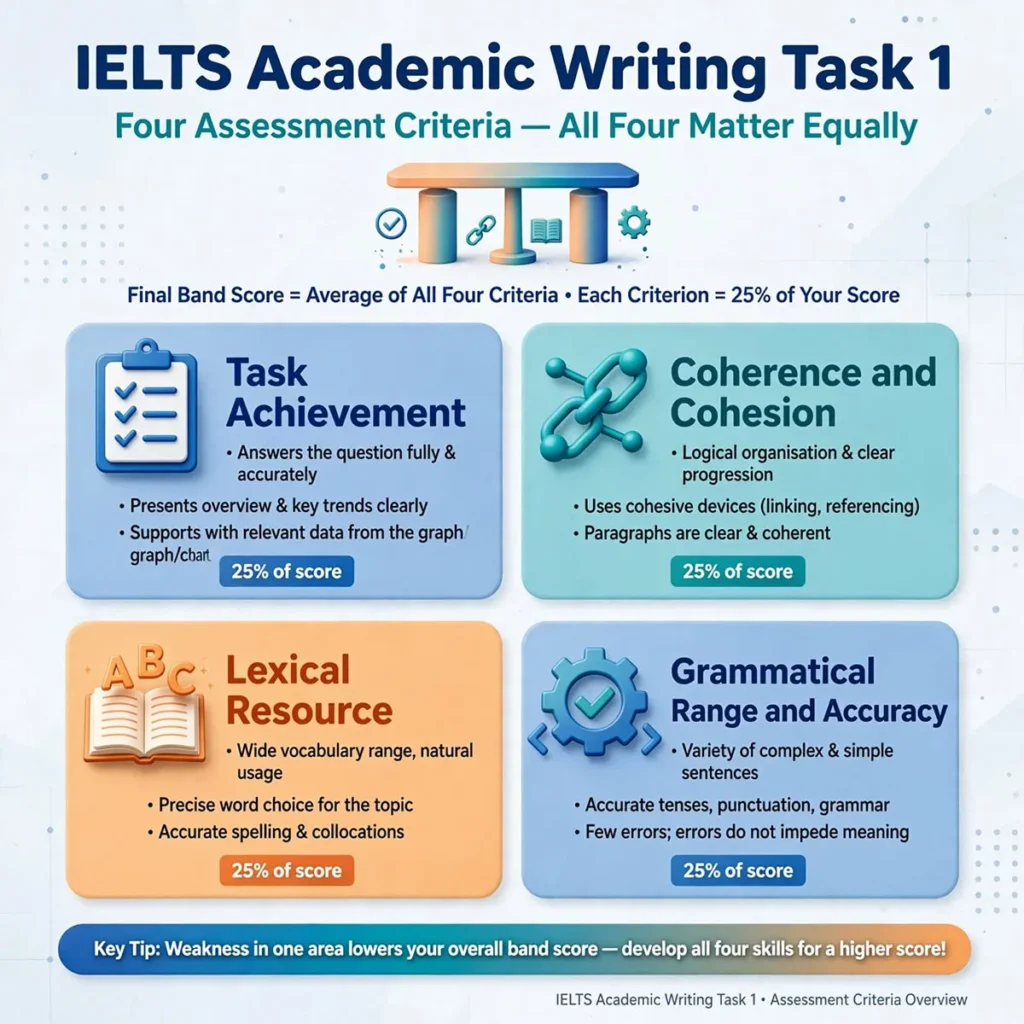
Examiners assess your report using four criteria. Each contributes equally to your Task 1 band score.
| Assessment criterion | What the examiner wants |
|---|---|
| Task Achievement | A clear overview, accurate information and relevant comparisons |
| Coherence and Cohesion | Logical organisation and effective linking |
| Lexical Resource | Appropriate vocabulary and accurate word choice |
| Grammatical Range and Accuracy | A variety of accurate sentence structures |
A report can contain advanced vocabulary and still receive a disappointing score if it lacks an overview or includes inaccurate comparisons.
For example, writing “The figure increased dramatically” when the graph shows only a small rise is a problem with accuracy, not vocabulary.
The Best IELTS Academic Writing Task 1 Structure
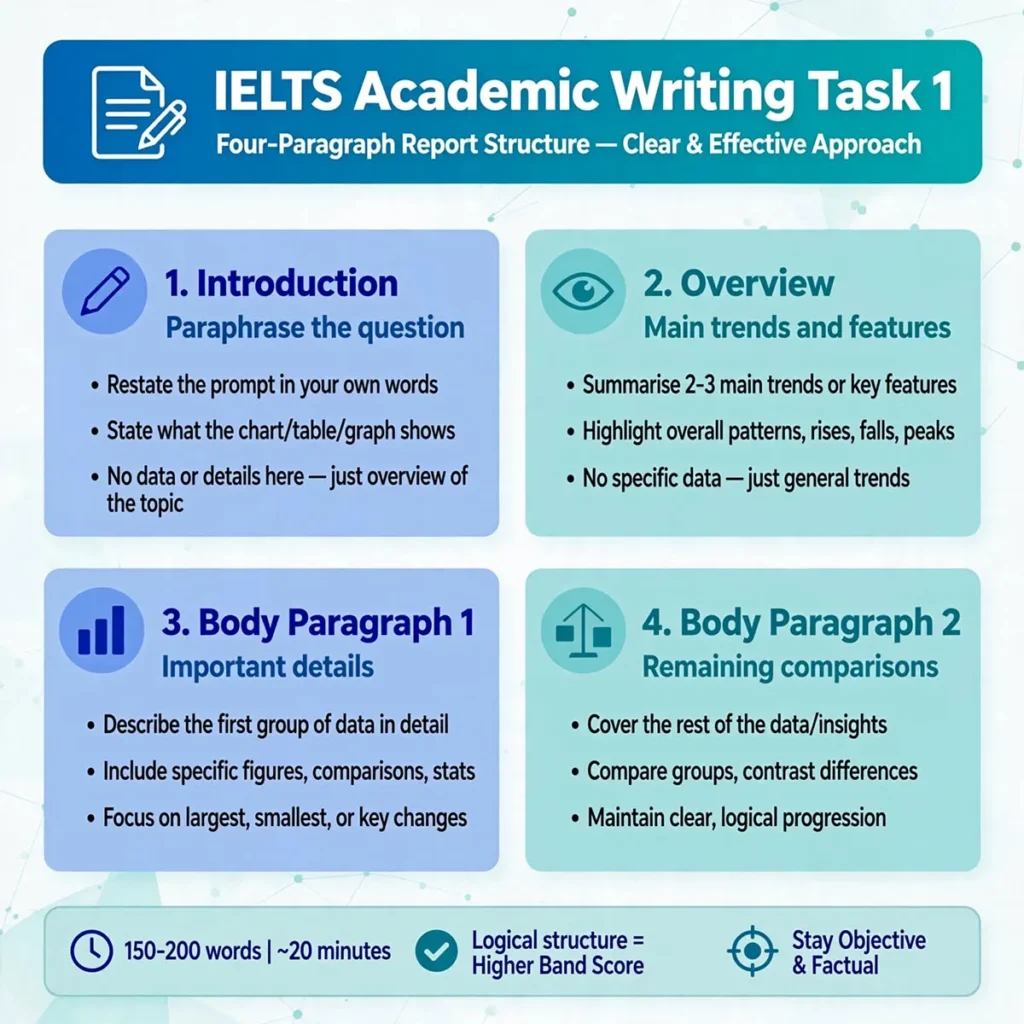
A reliable report normally contains four paragraphs:
- Introduction: Paraphrase the question.
- Overview: Summarise the main trends, features or stages.
- Body Paragraph 1: Describe the first group of important details.
- Body Paragraph 2: Describe the remaining important details.
This structure works well for many charts and tables. Maps and process diagrams may require slightly different organisation, but the principle remains the same: introduce the visual, give the reader the big picture and then support it with relevant details.
Paragraph 1: Write a Clear Introduction
The introduction should explain what the visual shows. Do not copy the question word for word.
For example, imagine the task says:
The line graph shows the percentage of people who used public transport in three cities between 2000 and 2020.
A suitable introduction would be:
The line graph illustrates the proportion of residents who used public transport in three cities over the period from 2000 to 2020.
Notice the changes:
- “Shows” becomes “illustrates”.
- “Percentage of people” becomes “proportion of residents”.
- The time period is expressed naturally.
You do not need to add an explanation for the changes. The introduction should remain concise.
Expert tip: Spend approximately two minutes planning and writing the introduction. The overview and body paragraphs deserve more attention because they carry the main descriptive content.
Paragraph 2: Write an Effective Overview
The overview is one of the most important parts of IELTS Academic Writing Task 1.
It tells the examiner what the main features are without listing every number.
For a line graph, you might identify:
- The overall upward or downward trend.
- The highest and lowest figures.
- A major difference between categories.
- A significant change or turning point.
For a process, you might explain:
- Where the process begins.
- Where it ends.
- How many major stages it contains.
- Whether it is linear or cyclical.
For example:
Overall, public transport use increased in all three cities, although City A experienced the most substantial growth. City C remained the least popular throughout the period.
This is effective because it identifies the major patterns rather than repeating individual data points.
Avoid writing an overview that says only:
Overall, there were some changes in the figures.
That statement is too vague to demonstrate understanding.
A useful rule: If the examiner reads only your overview, they should understand the main message of the visual.
Paragraphs 3 and 4: Support the Overview with Details
The body paragraphs should provide the evidence behind your overview.
Do not describe the visual from left to right without thinking about the information. Group similar figures together.
For a chart comparing four categories, you might group:
- The two highest values.
- The two lowest values.
- Categories with similar trends.
- Categories that changed in opposite directions.
For example:
In 2010, City A recorded the highest level of public transport use, at 45%, compared with 35% in City B and 20% in City C. By 2020, the figure for City A had risen to 65%, while City B reached 50%.
This paragraph compares the cities and includes relevant figures. It does not describe every year separately.
Remember: Your body paragraphs should explain the data, not simply reproduce it.
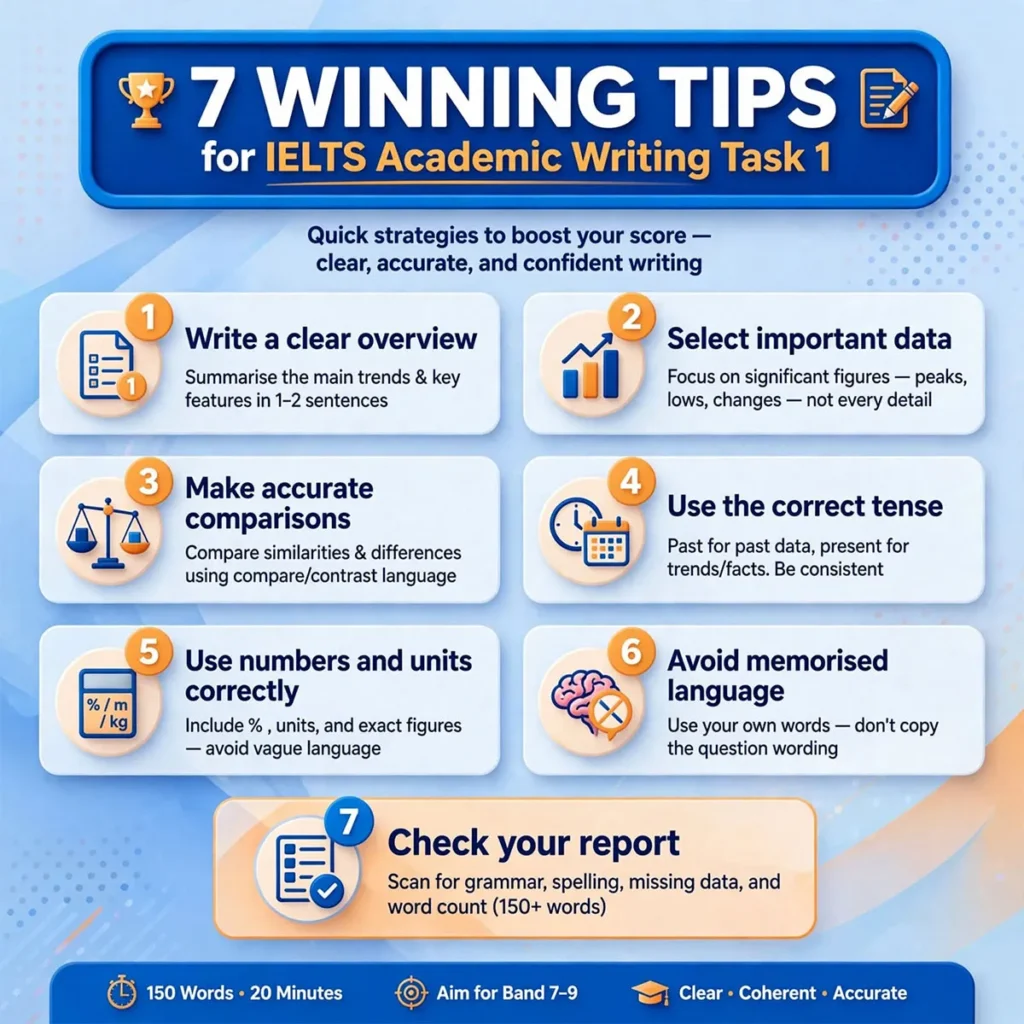
7 Winning Tips for a Higher IELTS Academic Writing Task 1 Score
1. Always Write a Clear Overview
A missing or weak overview can seriously affect Task Achievement.
Before writing your body paragraphs, ask yourself:
- What is the biggest overall trend?
- Which category is highest or lowest?
- What is the most noticeable difference?
- Is there a major change over time?
For example, if a graph shows four countries’ internet usage increasing between 2005 and 2020, the overview might mention that all countries experienced growth, while one country remained consistently ahead.
You do not need to mention every country in the overview.
2. Select Important Data Instead of Describing Everything
Many candidates believe that a good report must include every number. That approach often leads to a long, repetitive response.
Instead, select information that supports the main features.
For a graph with six years of data, you might mention:
- The starting figures.
- The ending figures.
- A major peak or low point.
- A notable difference between categories.
You should still cover the important features of the visual. Avoid selecting only the easiest numbers.
Band-improvement principle: Relevant comparisons are more valuable than a long list of isolated figures.
3. Make Comparisons with Accurate Language
Comparison is central to many Task 1 questions.
Useful expressions include:
| Purpose | Useful language |
|---|---|
| Higher value | Higher than, greater than, exceeded |
| Lower value | Lower than, less than, below |
| Similar figures | Similar to, comparable with, almost the same as |
| Difference | Whereas, while, in contrast |
| Highest point | The highest figure, peaked at |
| Lowest point | The lowest figure, fell to |
Example:
The percentage of students studying abroad was considerably higher in 2015 than in 2010.
Another example:
While the number of visitors to Museum A increased, attendance at Museum B declined.
Avoid repeating “higher than” in every sentence. Vary your language naturally, but do not use unfamiliar expressions unless you are confident they are accurate.
4. Use the Correct Tense
Tense depends on the time period and the type of visual.
Past dates: Use the past simple when describing completed periods.
The number of visitors increased from 2000 to 2010.
Present information: Use the present simple when describing a current situation or a visual without a past time period.
The diagram illustrates the process of recycling plastic.
Predictions: Use appropriate future forms when the visual shows projected figures.
The population is expected to rise over the next decade.
For process diagrams, the present simple passive is often useful:
The raw materials are transported to the factory.
Do not automatically use the past tense simply because you are describing a graph.
5. Use Numbers and Units Correctly
Accurate numerical language is essential.
Consider the difference:
- 25% means one quarter.
- 50% means half.
- 75% means three quarters.
- 100% means the whole amount.
If a figure rises from 20 to 40, you can write:
The figure doubled from 20 to 40.
If it rises from 20 to 30:
The figure increased by 10.
Be careful with “increase by” and “increase to”.
- Increased by 10 = the amount of change was 10.
- Increased to 30 = the final figure was 30.
Also distinguish between percentage and percentage points.
For example, if a rate rises from 20% to 30%, it increases by 10 percentage points. It increases by 50% relative to its original value.
In most IELTS reports, you do not need to calculate percentage growth unless it helps explain the data accurately.
6. Avoid Memorised Sentences and Unnatural Vocabulary
Memorised templates can be useful as a starting point, but they should not replace understanding.
For example:
It is crystal clear from the given graph that…
This sentence is unnecessary and sounds unnatural in an academic report.
A better introduction is:
The graph illustrates changes in household spending between 2010 and 2020.
Likewise, avoid using words such as “plummeted”, “soared” or “dramatically” unless the visual genuinely supports that description.
A small increase should not be described as a dramatic rise.
Experienced IELTS advice: Accurate, natural vocabulary is more valuable than impressive vocabulary used incorrectly.
7. Leave Time to Check Your Report
Reserve approximately two to three minutes at the end.
Check:
- Have I written at least 150 words?
- Is there a clear overview?
- Are my figures accurate?
- Have I used the correct tense?
- Are subject-verb agreements correct?
- Have I repeated the same words too often?
- Are the paragraphs logically organised?
A quick check can help you identify mistakes that would otherwise cost marks.
How to Describe Different Task 1 Visuals
Line Graphs
Line graphs usually show changes over time.
Focus on:
- Overall trends.
- Increases and decreases.
- Peaks and lowest points.
- Comparisons between lines.
- Periods of stability or fluctuation.
Useful verbs include:
- Rise
- Increase
- Grow
- Climb
- Fall
- Decline
- Drop
- Remain stable
- Fluctuate
Example:
The number of international visitors rose steadily between 2010 and 2015 before levelling off in 2016.
Do not describe every small movement if several lines follow the same pattern.
Bar Charts
Bar charts compare categories, which may represent countries, products, age groups or years.
Focus on:
- Highest and lowest categories.
- Similarities and differences.
- Significant gaps.
- Changes over time, if shown.
Example:
University A recorded the highest graduation rate, while University C had the lowest.
For grouped bar charts, organise the information logically rather than describing each bar separately.
Pie Charts
Pie charts show proportions of a whole.
Useful expressions include:
- Accounted for.
- Made up.
- Represented.
- Comprised.
- The largest share.
- The smallest proportion.
Example:
Food accounted for the largest share of household expenditure, at 35%, while transport represented only 10%.
Check whether the figures add up to 100%. This helps you understand the relationships between categories.
Tables
Tables can contain a large amount of information. Avoid writing one sentence for every row.
Instead:
- Identify the highest and lowest values.
- Find similar categories.
- Compare changes over time.
- Group related figures.
For example:
Country A had the highest average income in both years, whereas Country D recorded the lowest figures.
Maps
Maps usually show changes to a location, such as a town, university campus or shopping centre.
Your report should describe:
- What the area looked like before.
- What it looks like after.
- Major additions or removals.
- Changes in location and layout.
Useful language:
- Was replaced by.
- Was converted into.
- Was demolished.
- Was constructed.
- Was expanded.
- Was relocated.
- Remained unchanged.
Example:
The old car park was replaced by a public garden, while a new shopping centre was constructed to the east of the main road.
Use clear location language such as “to the north of”, “adjacent to” and “opposite”.
Process Diagrams
Process diagrams explain how something is made or how a system works.
Your report should include:
- An introduction.
- An overview of the stages.
- A clear description of the process in logical order.
Passive voice is often useful:
The materials are heated before being transferred to the next stage.
For a natural process, such as the water cycle, active voice may be more appropriate:
Water evaporates from the surface of the sea.
Avoid adding information that is not shown in the diagram.
Common IELTS Academic Writing Task 1 Mistakes
Mistake 1: Giving Your Opinion
Task 1 is not an opinion essay.
Avoid statements such as:
I believe public transport should be improved.
Instead, describe the information shown:
Public transport use increased over the period.
Mistake 2: Writing Without an Overview
A report containing only an introduction and detailed figures is incomplete.
Always identify the major features before describing the supporting information.
Mistake 3: Listing Numbers Without Comparisons
This approach may show that you can read figures, but it does not demonstrate strong reporting skills.
Compare the data and explain the most important differences.
Mistake 4: Using Inaccurate Vocabulary
Do not describe a stable figure as “dramatically fluctuating”.
Do not use “tripled” when the figure only doubled.
Choose words that match the visual evidence.
Mistake 5: Writing Too Much Background Information
The report should focus on the visual. You do not need to explain the history of a city or why a trend might have occurred unless the information is explicitly provided.
Mistake 6: Ignoring the Word Count
You must write at least 150 words. However, writing excessively long reports can waste time that should be used for Task 2.
Aim for approximately 160–190 words when that is enough to cover the important features accurately.
A Practical 20-Minute IELTS Academic Writing Task 1 Plan
Use this timing strategy during practice:
| Time | Task |
|---|---|
| 0–2 minutes | Read the question and identify the visual type |
| 2–5 minutes | Identify the main features and plan the overview |
| 5–7 minutes | Write the introduction and overview |
| 7–17 minutes | Write the two body paragraphs |
| 17–20 minutes | Check grammar, vocabulary and figures |
This is a flexible plan, not a strict rule. If you need more time to understand a complicated visual, adjust your timing.
The most important thing is to avoid spending too long on the introduction.
Frequently Asked Questions About IELTS Academic Writing Task 1
How many words should I write in IELTS Academic Writing Task 1?
You must write at least 150 words. A report of approximately 160–190 words is often a practical target, provided it covers the key features accurately.
Is an overview necessary in IELTS Academic Writing Task 1?
Yes. A clear overview is essential for a strong Task Achievement score. It should summarise the main trends, differences or stages without listing every detail.
Can I give my opinion in Task 1?
No. Academic Writing Task 1 requires you to describe, summarise or explain the visual information. Personal opinions and unsupported explanations are not appropriate.
What is the best structure for IELTS Academic Writing Task 1?
For many charts and tables, use four paragraphs: introduction, overview, body paragraph 1 and body paragraph 2. Maps and processes may need a slightly different structure.
Should I memorise a Task 1 template?
Learn a flexible structure and useful language, but avoid memorising complete sentences that may not fit the question. Your report should sound natural and accurately describe the visual.
How can I improve my Task 1 vocabulary?
Practise vocabulary in groups: trends, comparisons, proportions, locations and process stages. Learn how to use each word accurately in a sentence rather than memorising long lists.
Can I use the same structure for every visual?
The basic four-part structure works well for many charts and tables. Maps and process diagrams require different types of language and organisation, so adapt your report to the visual.
Final Advice from IELTSOMA
IELTS Academic Writing Task 1 becomes much easier when you stop trying to describe everything and start focusing on what matters most.
A strong report has a clear introduction, a meaningful overview, accurate comparisons and well-organised supporting details.
Practise with different visual types, review your mistakes and improve your vocabulary gradually. Most importantly, learn to identify the main features before you begin writing.
Your goal is not to write the longest report or use the most complicated words. Your goal is to communicate the information clearly, accurately and confidently.
With consistent practice and a reliable approach, you can make meaningful progress towards your target IELTS Writing band score.
Further Reading: